View Stats Youtube
Learn how to view stats YouTube creators use in Studio, interpret metrics, compare periods, and turn analytics into pipeline decisions for dev agencies.
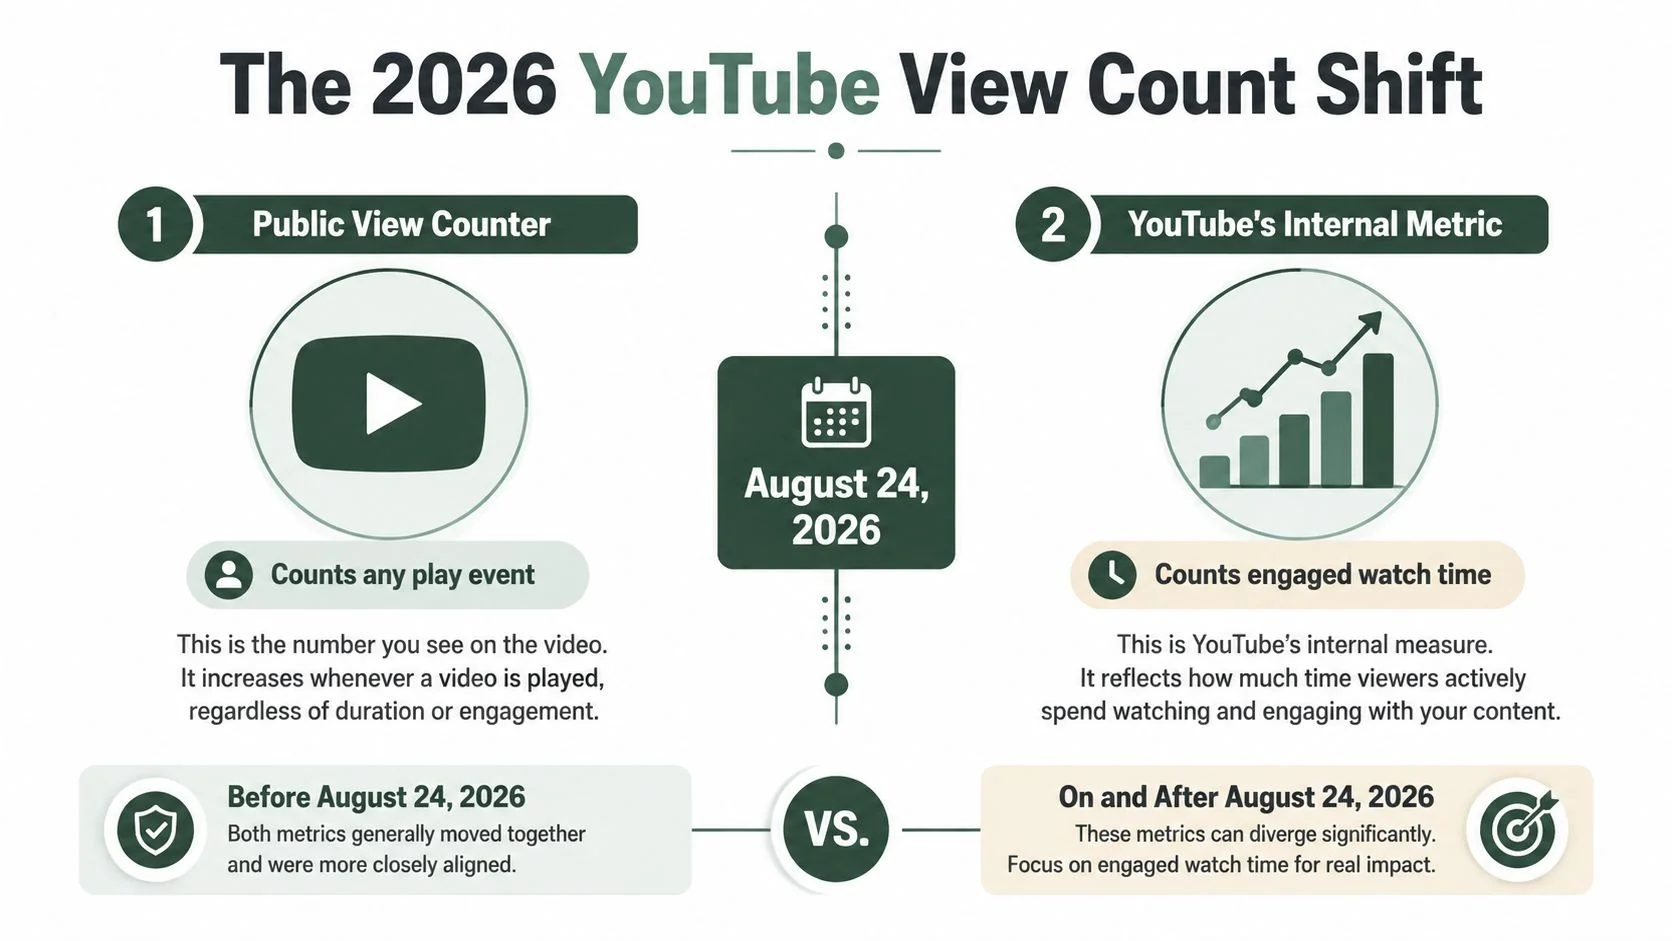
As of August 24, 2026, a YouTube view is counted the moment a video starts playing, while YouTube Studio separately reports engaged views for viewers who continue past the initial seconds. That means public views and the metric closest to real attention are no longer the same number.
For a software development agency, this changes how YouTube should enter a pipeline report. A raw counter can describe distribution, but it can’t tell a partner whether a CTO watched a technical explanation, whether the viewer came from a niche search, or whether the session contributed to a qualified conversation. View stats on YouTube are now a cross-surface measurement problem spanning Shorts, long-form video, live streams, connected TV, external traffic, and Studio’s engagement reports.
The scale makes the distinction commercially relevant. YouTube had roughly 2.7 to 2.8 billion monthly users in 2026, and market coverage reported more than 1 billion hours of daily viewing on the platform, according to 2026 YouTube platform data. The audience is large enough for niche authority, but its size also makes unqualified view totals easy to misread.
Why View Stats on YouTube Changed in 2026
On August 24, 2026, YouTube changed its global public counting rule. A public view now begins when Shorts, long-form video, podcasts, or a live stream starts playing, according to YouTube’s view-counting guidance. YouTube Studio also exposes engaged views, which represent viewers who stayed beyond the initial seconds rather than treating every play as equal attention.
That creates two operational datasets. The public counter answers, “How many play events occurred?” Engaged views answer a more useful marketing question, “How many people chose to continue watching?” The totals can diverge without either number being incorrect.
The reporting consequences
Agency benchmarks must now label the metric and the counting regime. A dashboard that reports public views beside older historical totals is comparing numbers created under different rules, because YouTube says existing totals aren’t recalculated. A client report that cites public views while calling them “watched views” is no longer precise enough for a technical buyer journey.
The change also affects recognition-first content. A developer may encounter an agency through a play event, but niche recognition is better represented by sustained viewing, retention, traffic source, returning viewers, and a subsequent site action. AI citation behavior should be evaluated alongside engaged viewing, because accidental playback can inflate reach without creating the familiarity needed for a buyer to recognize an agency later.
Practical rule: Put public views, engaged views, retention, traffic source, and pipeline action in separate columns. Never compress them into one “YouTube performance” field.
The rest of the measurement system follows from that separation. Traffic sources show discovery intent, retention shows whether the explanation earns attention, and revenue metrics show whether the audience has commercial value. For another practical perspective on interpreting creator-side performance, see this data-driven YouTube growth resource for creators.
Reaching YouTube Studio Analytics on Desktop and Mobile
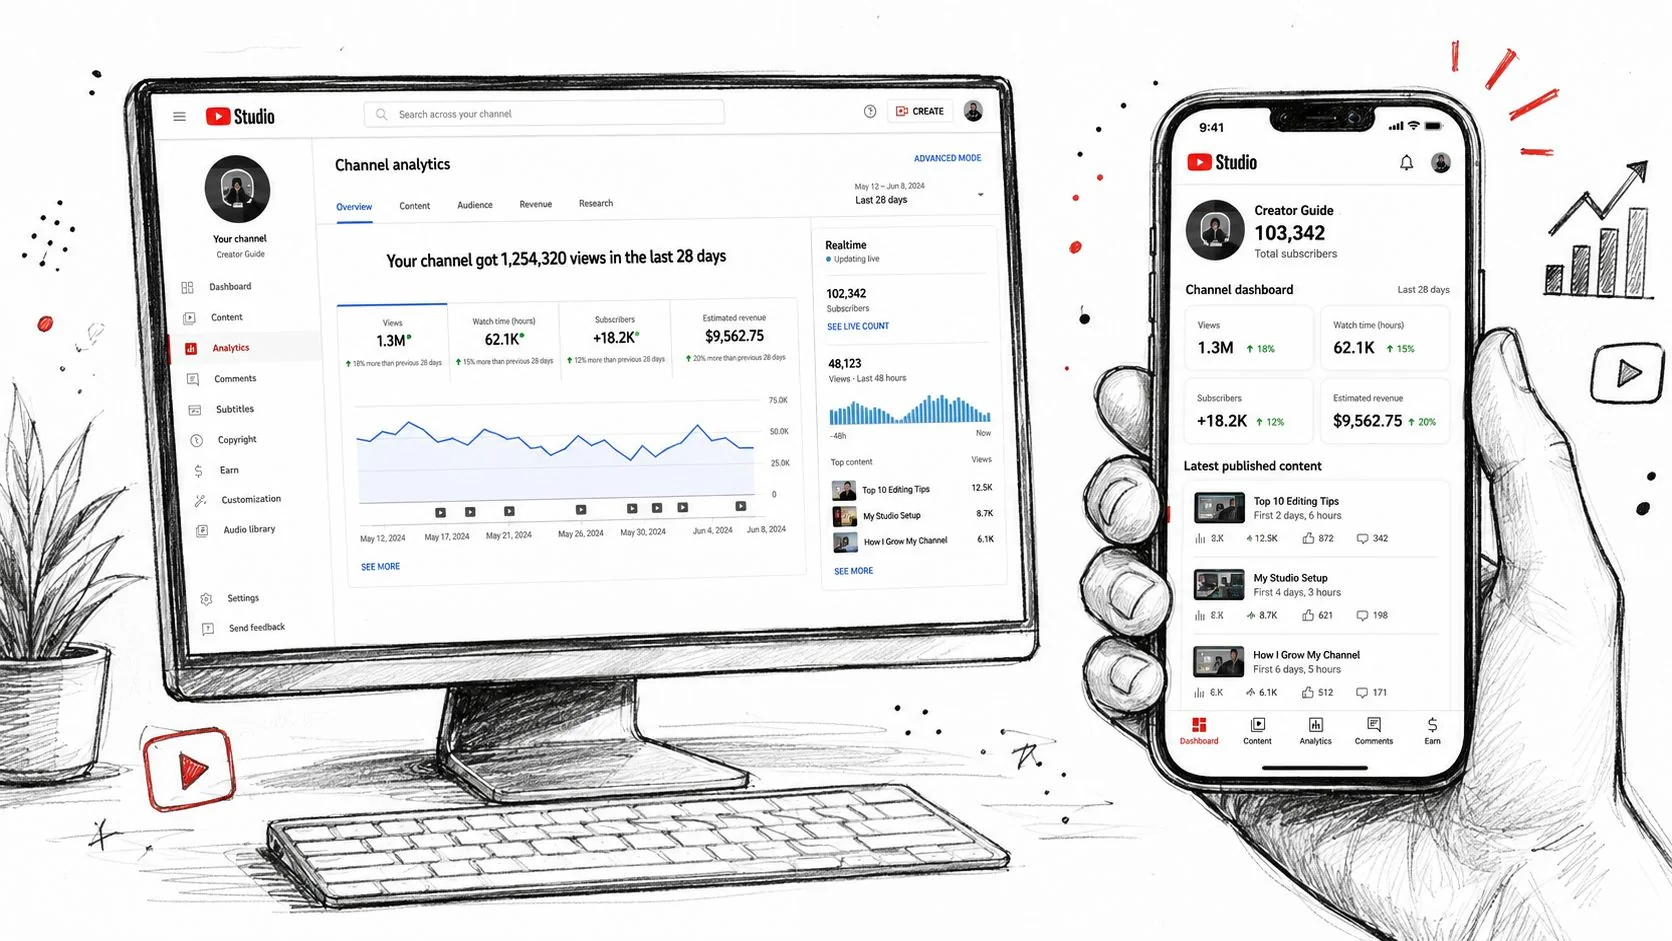
Desktop access starts at studio.youtube.com. Sign in with a channel owner, manager, or editor account that has permission to view analytics, then select Analytics in the left rail. Use the date selector to choose Last 28 days, Last 90 days, a custom range, or Lifetime.
The Analytics workspace has three primary sub-tabs:
- Overview shows the channel summary and the Realtime card.
- Content breaks performance down by formats and videos.
- Audience shows viewer and audience behavior available to the channel.
Under Content > Videos, locate the engaged views column where the account exposes it, then compare it with public views rather than replacing one with the other. The Overview Realtime card is useful immediately after publication, but YouTube describes those numbers as estimates. The Realtime report updates every 10 seconds for the 25 most recent uploads and provides estimated data for the last 48 hours and the last 60 minutes, as documented in YouTube’s Realtime Analytics guidance.
Mobile access and permissions
In the YouTube Studio mobile app, tap your profile, open Channel dashboard, and select the Analytics icon. The mobile interface is suitable for checking realtime movement, recent views, and audience signals, but a BDR preparing a client report should confirm the date range and metric definitions on desktop.
Agencies operating several channels may also encounter YouTube Studio for Artists or Studio Content Manager. Those environments can expose different channel, rights, or content-management contexts, so the operator must confirm the channel identity before exporting data. A report from the wrong managed channel is a process failure, not an analytics insight.
Before pulling any report, every BDR should locate these six elements:
- Channel identity, including the correct managed account.
- Analytics date range, with the comparison window recorded.
- Overview Realtime card, for immediate estimates.
- Content > Videos, including public and engaged views.
- Audience tab, including unique viewers where available.
- Traffic source and retention reports, which connect attention to discovery and depth.
If the team also reports organic acquisition outside YouTube, keep the same date discipline in adjacent systems. A useful reference for connecting channel data with site-side measurement is this guide to analytics for WordPress SEO.
The Metrics That Actually Predict Pipeline
Pipeline reporting needs more than the view total. YouTube’s Analytics help distinguishes views and unique viewers from engagement-based reporting, including engaged views, as described in YouTube’s Analytics metric definitions. That distinction lets an agency separate distribution, audience size, attention, and commercial response.
The following table uses practical operating thresholds for agency decisions. These are decision rules, not claims about universal YouTube benchmarks.
| Metric | Pipeline Threshold | Action Trigger |
|---|---|---|
| Public views | Rising distribution with a named traffic source | Keep only when reach also produces engaged viewing or site action |
| Engaged views | Roughly 55% or more of total views for technical content | Retain the topic and study the opening, promise, and audience fit |
| Unique viewers | Expanding reach without a matching collapse in depth | Build adjacent videos for the same buying committee |
| Watch time and average view duration | Sustained consumption relative to the video’s intended depth | Repurpose sections that hold attention into search and sales assets |
| Audience retention curve | A stable opening followed by continued viewing | Re-cut the first explanation when viewers leave immediately |
| Impressions and click-through rate | CTR at or above 4% | Test title and thumbnail when CTR falls below 4% |
| Traffic sources | Discovery from Search, Suggested, Shorts feed, or qualified External traffic | Assign the winning source to the next topic and distribution plan |
| CPM, RPM, and subscriber conversion | Improving commercial quality and audience compounding | Separate AdSense income from broader pipeline value |
Views and engaged views
Public views are useful for measuring exposure after the 2026 rule change. Engaged views are better for judging whether a technical explanation earned continued attention. A practical rule for niche content is to treat engaged views above roughly 55% of total views as a qualified-audience signal, then verify that interpretation against retention and traffic source.
That ratio isn’t a lead score. It can still represent students, peers, job seekers, or existing subscribers. But a weak ratio paired with broad, untargeted distribution usually tells the agency that the packaging reached people who weren’t a fit for the subject.
Retention, reach, and packaging
Unique viewers work as a reach proxy, while watch time and average view duration show depth. The audience-retention curve is the diagnostic layer. A sharp early drop points to a mismatch between the title promise and the opening, or to a presentation that makes the viewer wait for the answer.
Impressions and click-through rate belong to packaging tests. A video with high impressions and CTR below 4% is a candidate for a title or thumbnail re-cut. Don’t rewrite the script first when the audience hasn’t clicked. Conversely, a strong CTR with weak retention points to a promise the video fails to deliver.
Traffic source gives the content team its next operating decision. Search indicates explicit discovery, Suggested indicates adjacent-content relevance, and the Shorts feed indicates short-form distribution. External traffic can be valuable when it comes from a niche community, partner, newsletter, or sales sequence. These sources shouldn’t be blended because each represents a different acquisition path.
Revenue metrics need the same separation. CPM and RPM describe advertising economics, while AdSense is one monetization route inside the broader YouTube Partner Program. Subscriber conversion rate indicates whether a video creates a reason to return. For an agency, the leading commercial question isn’t whether a video earns ads. It’s whether the right viewers subscribe, visit the site, respond to outreach, or enter a tracked opportunity.
Use this guide to building agency revenue streams when mapping those actions into the wider revenue model.
Shorts, Long-Form, Live, and TV Compared
Format changes the meaning of every view. Tubular Labs data reported that 77% of global YouTube views in 2025 came from videos under one minute, up from 70% in 2024, while U.S. YouTube viewing reached 45.1 billion hours in the first half of 2025 and TV represented 36% of viewer hours, according to TVREV’s coverage of the Tubular and TV viewing data.
Those numbers don’t mean every agency should shift production to Shorts. They mean the operating team must compare format-specific attention before allocating production hours. A thirty-second discovery clip and a technical architecture session can both generate a view, but they serve different steps in a buying process.
| Format | Share of Attention | Typical Retention | Revenue Signal | Best Agency Use |
|---|---|---|---|---|
| Shorts | Dominant share of global views under one minute | Often shallow when the clip runs beyond its strongest hook | Distribution and subscriber discovery | Test positioning, expose a niche problem, route viewers to deeper content |
| Long-form | Smaller volume than short-form, deeper session potential | Better suited to sustained technical explanation | Watch time, RPM, qualified action | Demonstrate delivery competence and answer evaluation questions |
| Live | Event-driven and dependent on session participation | Variable, with value concentrated in active segments | Community depth and sponsorship context | Workshops, technical briefings, launches, and executive Q&A |
| TV or connected TV | 36% of U.S. viewing hours | Living-room consumption changes viewing context | Reach and longer-session opportunity | Flagship authority content and category-level visibility |
YouTube Studio’s Reach and Content reports should be compared across the same channel and the same 30-day window. Review impressions, view velocity, average view duration, and traffic source for each format. Don’t compare a Shorts view total directly with a long-form total and call the larger number the winner.
Shorts can expose a narrow problem quickly, but retention often falls once a short clip runs beyond its strongest opening. Long-form gives a technical agency more room to explain constraints, tradeoffs, security, delivery process, and proof. That longer session context matters when the viewer needs to assess whether the agency can handle a complex engagement.
For a broader short-form comparison before assigning production work, review this StreamGen TikTok versus YouTube analysis. The agency rule is simple: pick a primary format based on the niche and buying question, then use the comparison view to defend that choice in planning meetings.
Exporting and Sharing Studio Reports
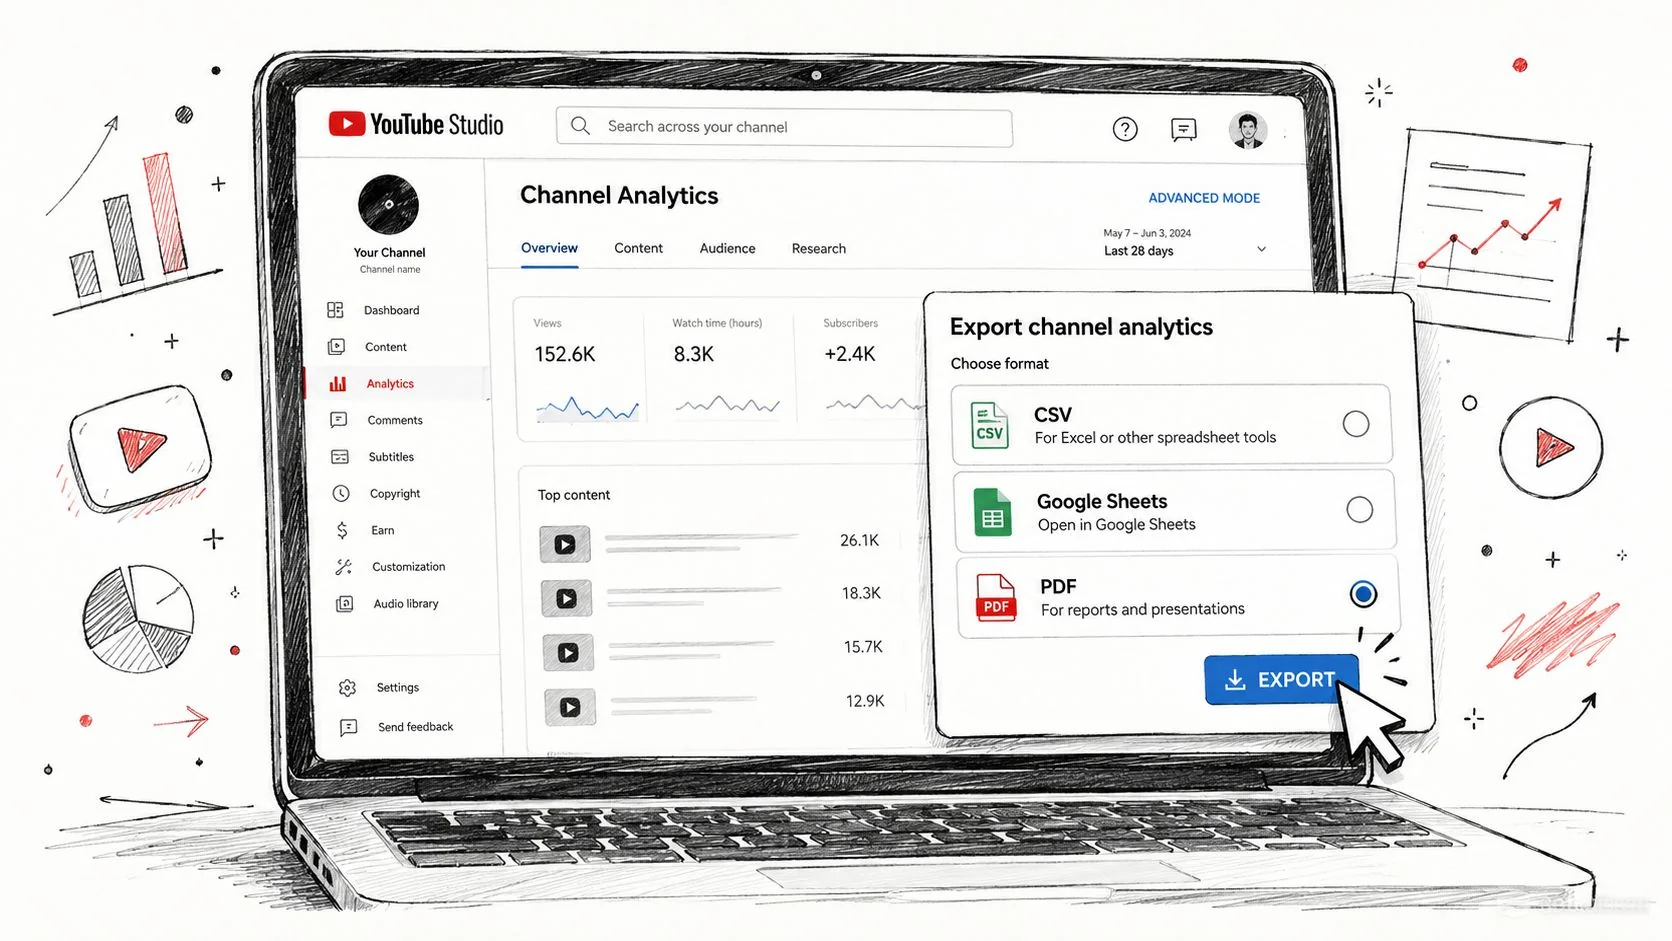
YouTube Studio analytics only becomes useful to revenue operations when the data leaves the platform in a controlled form. Open Analytics, select any tab, choose Export, then use Save as CSV or Save to Sheets. Keep the date range visible in the export, whether the team uses Last 28 days, Last 90 days, a custom range, or a quarter-over-quarter comparison.
Match the format to the job
CSV is the right choice for raw analysis, joins, and repeatable transformations. Google Sheets supports live collaboration between account managers, content leads, and revenue operations. Scheduled email reports serve stakeholders who won’t log into Studio, but the email must still identify the metric definition and reporting window.
A practical downstream workflow looks like this:
- Looker Studio: Connect a controlled Google Sheet for client-facing dashboards.
- CRM: Push CSV slices into a view-attributed lead-source field, with the video identifier preserved.
- Account management: Schedule weekly email reports for stakeholders who need movement, not raw exports.
- Content planning: Join traffic sources and retention with the video topic, format, and target niche.
The audit rule matters more than the export button. Every file should carry the channel ID, date range, and currency. Add the public-versus-engaged metric label as well. Without those fields, two client reports can look comparable while measuring different channels, periods, or definitions.
A screenshot proves that someone opened Studio. An export with a channel ID, date range, and metric definition can support a pipeline decision.
Benchmarking Agencies Against the 1,700-Agency Dataset
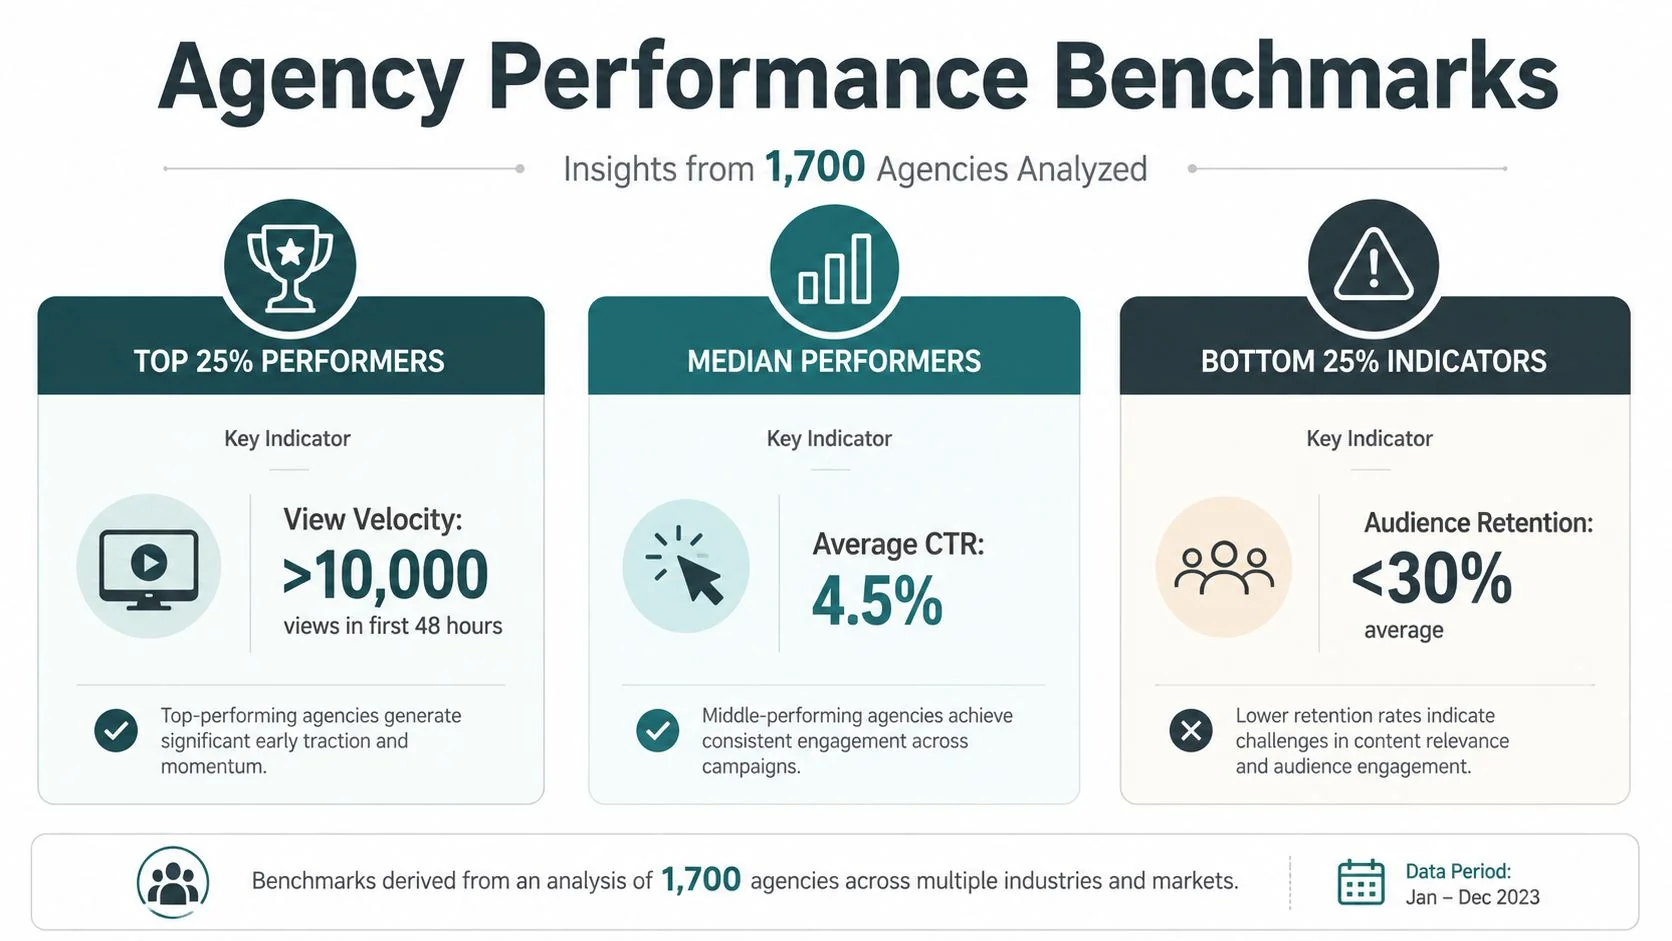
A benchmark is useful only when it changes an operating decision. The 1,700-agency dataset can serve as a reference point for view velocity per video, subscriber-to-view ratio, impression-to-view CTR, and revenue per thousand views, but the supplied benchmark values should be treated as the dataset’s defined cutoffs, not universal YouTube laws.
The benchmark graphic identifies three comparison points: top performers exceed 10,000 views in the first 48 hours, median performers show 4.5% average CTR, and bottom-quartile indicators include average audience retention below 30%.
Use the benchmark as a positioning tool
Pull the client’s last 90 days from Studio, then align each video with its niche, format, traffic source, and publication date. Compare the client against the relevant peer group, not against entertainment channels or global outliers. Flag the two or three metrics where the channel sits furthest above or below its peers.
The commercial value comes from the pattern. A client with modest public views but strong retention on developer-tool content may have a more defensible position than a channel with broad reach and weak audience depth. A channel with high CTR but low retention likely owns packaging, not authority.
Avoid leaderboard language in quarterly business reviews. Tell the client which metric demonstrates niche fit, which metric blocks distribution, and which production change should address the gap. An agency that can show superior retention for a specific technical buying audience has a stronger positioning argument than one that quotes a large undifferentiated view count.
Make benchmark conversations the standard replacement for vanity reporting. The QBR should end with a decision about topic, format, packaging, or distribution, not with a celebration of the biggest number.
Turning YouTube Stats Into Pipeline and Niche Authority
The useful YouTube question is not, “Which video got the most views?” It’s, “Which video created the strongest evidence that the right buyer recognized the agency?” The August 2026 counting change makes that distinction explicit because a public view can begin at playback, while engaged views show deeper behavior.
Create a pipeline-attributed view record for every priority video. Connect the video URL, traffic source, engaged views, retention, subscriber action, site session, demo request, booked call, and opportunity stage. Capture whether a prospect cited the video in a form, sales call, or reply. Track AI citations separately because a mention in an AI answer indicates recognition behavior, not proof that every cited person watched the video.
The comparison below keeps vanity reach separate from commercial movement.
| Metric | What It Measures | Agency Decision It Informs |
|---|---|---|
| Public views | Play-event distribution | Whether the topic reached a surface or audience |
| Engaged views | Continued viewing beyond initial playback | Whether the opening and subject attracted real attention |
| Watch time | Total consumed viewing | Whether the topic supports deeper education |
| Retention curve | Where attention survives or fails | Which section to rewrite, cut, or repurpose |
| Traffic source | How viewers discovered the content | Which distribution channel deserves more investment |
| Demo requests citing a video | Direct response from a viewer | Whether the content belongs in sales sequences |
| Calls booked from YouTube leads | Pipeline entry associated with channel activity | Whether the format deserves production priority |
| AI citations and search visibility | Recognition in buyer research surfaces | Whether the topic is building defensible category presence |
The “views are vanity” argument is incomplete. Views are weak when they stand alone. They become useful when the team can identify the surface, audience, attention depth, and downstream action behind them.
For topic selection and measurement discipline, use this data-driven SEO guide alongside YouTube exports. The same operating model applies across search and AI assistants: identify the niche question, publish an answer that earns recognition, measure qualified attention, and connect that attention to commercial movement.
A partner should be able to answer two questions in every QBR. Which videos moved pipeline? Which formats are building defensible niche ownership faster than paid search can buy it? If Studio data can’t answer both, the agency is still reporting media activity rather than managing demand generation.
If your agency needs YouTube to support a specific software niche, request a free positioning scan from 100Signals. The scan can identify which topics, formats, and recognition signals should connect to your target accounts, then turn those findings into a pipeline plan built around niche ownership rather than raw view volume.