Rate of Response Benchmarks for Dev Agencies
Stop chasing vanity metrics. Learn how to calculate, benchmark, and improve your rate of response to build predictable pipeline for your dev agency.
Most advice about rate of response starts with the wrong question: “What’s a good reply rate?” The number has no meaning until you state the denominator, audience, message stage, and response type. A 10% reply rate from a small, already-engaged audience isn’t directly comparable with a 1% rate from a broad, cold population.
For a software development agency, this distinction determines whether outbound produces qualified meetings or merely fills a dashboard. Founders who optimize one blended percentage often scale the least valuable audience. The better operating rule is simple: report the full funnel by cohort, then judge outreach by qualified pipeline rather than inbox activity.
Defining Rate of Response in B2B Outreach
The basic formula is:
Rate of response = responses ÷ the stated denominator
That denominator might be delivered messages, unique recipients, total accounts, openers, or an entire sequence. Each version answers a different question. A reply-per-send rate measures delivery efficiency. A unique-account response rate shows how many companies engaged. A positive-response rate indicates commercial interest. A qualified-meeting rate connects outreach to pipeline.
The denominator problem is not a minor reporting detail. Pew Research Center’s 2026 methodology illustrates how sharply the answer can change when the measurement stage changes. In one panel study, 5,195 of 5,852 sampled panelists completed the survey, creating an 89% survey-level response rate, while recruitment nonresponse and later attrition reduced the cumulative response rate to 3%. The same methodological context reported an American Association for Public Opinion Research Response Rate 1 of 28%. Pew Research Center’s methodology shows why completion among already-recruited participants cannot stand in for reach across the original population.
Practical rule: Never approve a benchmark without asking, “Response from whom, at which stage, and divided by what?”
For agency reporting, record at least delivered-message response rate, unique-account response rate, positive-reply rate, and qualified-meeting rate. Keep cold, warm, and intent-based cohorts separate. A founder building authority in one vertical needs to know whether an account replied because it recognized the agency’s expertise or because a generic message happened to land at the right moment.
That’s why channel-specific operating resources, such as this outbound LinkedIn sales playbook, are useful only when their measurement definitions are made explicit. Founders can also use agency growth resources from 100Signals to structure reporting around agency-specific pipeline rather than broad marketing averages.
Why Blended Benchmarks Fail Dev Agencies
A blended rate hides the commercial difference between an unknown company and a recognized specialist. If an agency adds replies from former clients, newsletter subscribers, search visitors, referrals, and cold contacts, then divides them by total sends, the resulting average describes none of those groups accurately.
The problem becomes more severe when the agency sells complex engineering work. A buyer evaluating legacy modernization, claims processing, logistics integration, or regulated workflows usually needs evidence that the vendor understands the operating environment. A cold contact with no prior exposure needs a different explanation from a prospect who has already read the agency’s technical material. Combining both responses makes future forecasts unstable.
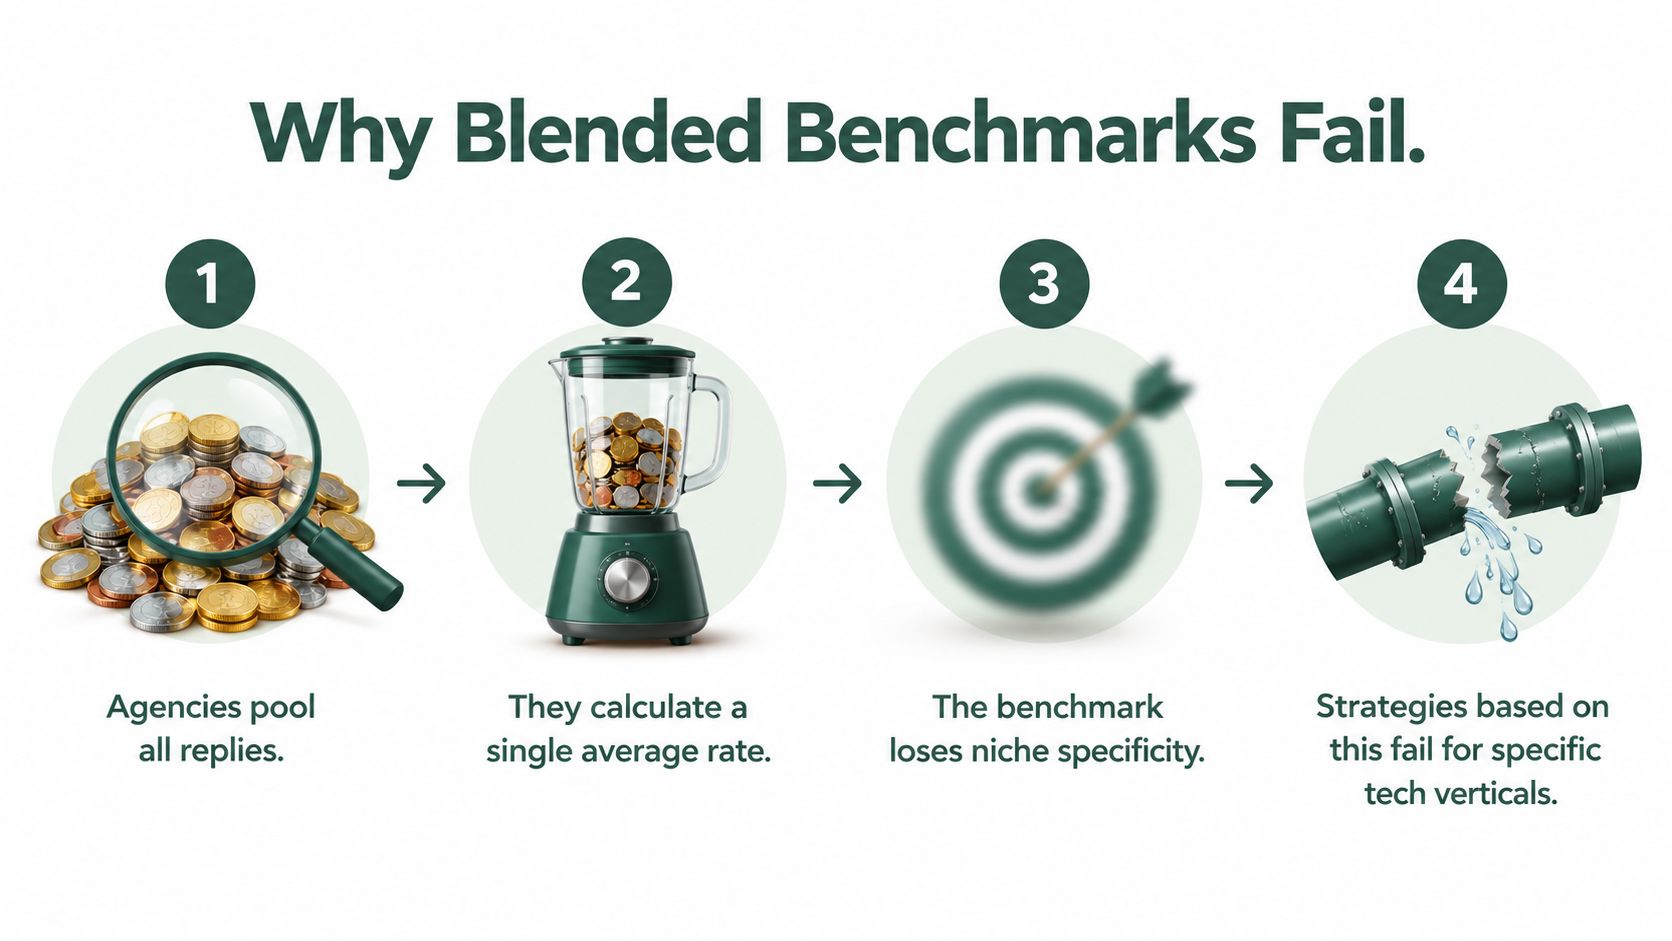
Segment the denominator before changing the copy
Use cohorts that reflect the buyer’s starting awareness:
| Cohort | Entry condition | Reporting question |
|---|---|---|
| Cold | No recorded interaction or prior relationship | Does the problem framing earn attention? |
| Warm | Prior content, referral, event, or brand interaction | Does recognition convert into a conversation? |
| Intent-based | Observable research or active business trigger | Does the offer match the current need? |
This structure prevents a warm audience from making a cold campaign look healthy. It also reveals whether niche authority is doing useful work before the email is sent. A lower raw rate from a carefully selected, recognition-primed account set can represent better pipeline than a higher rate generated by broad, low-context outreach, because commercial value sits downstream of the reply.
The same logic applies to list size. Benchmark data reports approximately 5.8% reply rates for tightly filtered campaigns targeting fewer than 50 contacts, compared with about 2.1% for indiscriminate campaigns targeting more than 1,000 contacts. The source also reports advanced personalization reaching roughly 18%, but treats those figures as directional because audience mix and methodology vary. Eludic’s actionable cold email optimization advice is useful as a tactical reference, not as a universal promise.
Report the segment, persona, trigger, and message angle beside every rate. Without those fields, an agency can’t tell whether performance came from better targeting, stronger recognition, a smaller denominator, or a temporary buying event.
Realistic Response Benchmarks by Audience Temperature
A high raw reply rate can hide weak pipeline. A lower rate from a tightly targeted, recognition-primed list may produce more qualified conversations than broad outreach that generates casual responses. Benchmark figures are useful for setting test conditions, not for promising outcomes.
| List Strategy | Target Size | Expected Reply Rate | Pipeline Quality |
|---|---|---|---|
| Tightly filtered cold campaign | Fewer than 50 contacts | Approximately 5.8% | Higher relevance potential, but too small for a broad forecast |
| Indiscriminate cold campaign | More than 1,000 contacts | About 2.1% | More volume, weaker message-market fit |
| House direct-mail list | Existing relationship | 9% | Stronger familiarity signal |
| Direct-mail prospect list | Cold prospects | 4.9% | Lower familiarity and weaker prior permission |
| Structured follow-up sequence | Four to seven touches | Higher than initial contact alone | More opportunities to capture delayed attention |
| No follow-up | Initial message only | Lower than a structured sequence | Understates interest from unavailable or distracted buyers |
The cold-email figures come from B2B email marketing benchmark research. The direct-mail comparison comes from the Data & Marketing Association benchmark summary. These sources measure different audiences and delivery environments, so their figures are directional rather than interchangeable forecasts.
What the numbers say about niche strategy
List concentration improves more than personalization. A narrow account set gives an agency room to form a specific pain hypothesis, identify a relevant technical trigger, and write for a defined role. A generic database encourages broad claims such as “we build scalable software,” which gives a technical buyer little reason to respond.
Campaign-size data points in the same direction. Sequences sent to 21 to 50 recipients averaged 6.2% replies, compared with 2.4% for sequences sent to 500 or more, according to BlazeHive’s cold email statistics. The comparison does not prove that smaller lists always win. It shows why list specificity and buying-context fit belong beside copy in campaign analysis.
Use controlled cohorts rather than one blended rate. Keep deliverability conditions similar, then compare positive replies and qualified meetings with total replies. A reply may be an objection, a referral, an unsubscribe request, or a polite acknowledgment. Those outcomes should not share the same denominator as a sales conversation.
LinkedIn-assisted campaigns require the same discipline. Guidance on personalization and sequencing on LinkedIn can shape the touch pattern, while campaign records should show whether the account recognized the agency, engaged with a niche asset, or received only a first-touch message. Recognition changes the meaning of the observed rate, and pipeline quality determines whether the rate matters.
Variables That Drive Reply Rates in Technical Niches
A high raw reply rate can hide weak targeting. In technical outreach, a smaller response rate from a recognition-primed account list may produce more qualified pipeline than a larger rate from a broad cold list. The denominator determines what the metric actually says.
Copy remains one variable among several. Timing, perceived technical competence, account relevance, and prior category recognition all affect whether a buyer responds. A message can be accurate and well written yet fail because the account has no active trigger or reason to believe the agency understands its environment.
Follow-up cadence also changes performance. Repeated contact gives delayed attention another opportunity, but each message should add a new reason to respond. Preserve the original context, then introduce a relevant trigger, a concise proof point, or a lower-friction question. Judge the sequence by positive replies and qualified meetings, not by total responses alone.
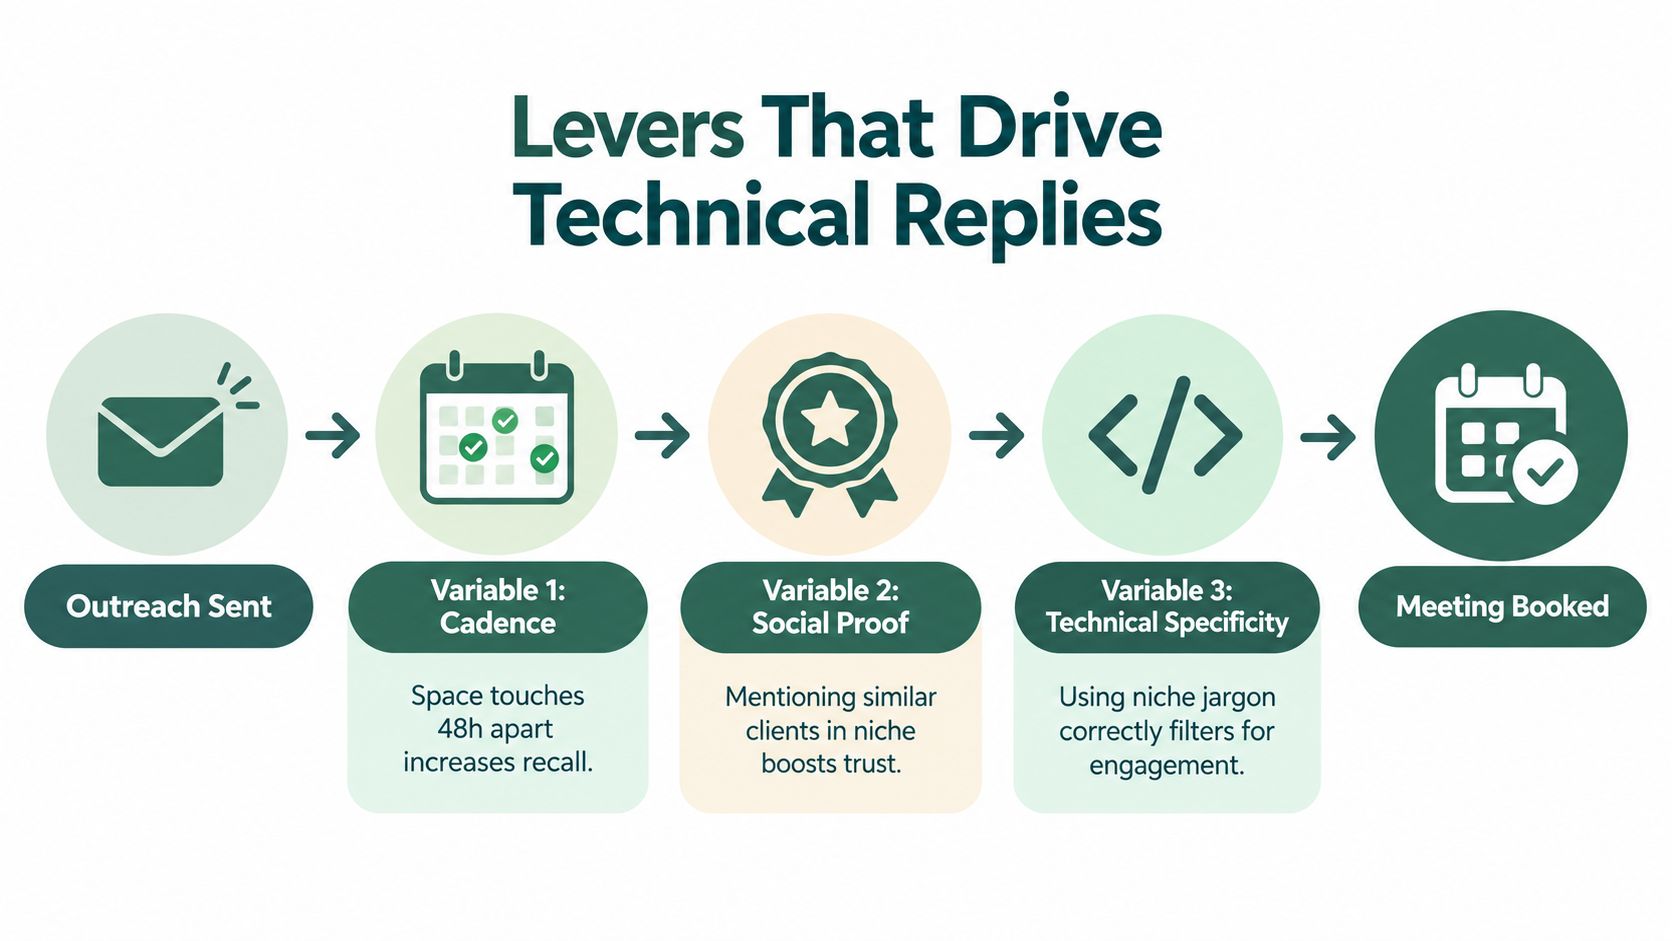
Recognition comes before persuasion
More sends will not correct a recognition deficit. 6sense’s 2024 Buyer Experience Report found that 81% of B2B buyers had selected a preferred vendor before speaking with a sales representative. 6sense’s report shows why an agency’s first email may arrive after the buyer has already formed a shortlist.
Measure pre-outreach authority as a campaign variable. Build a specific technical argument for one vertical, publish it where relevant buyers research, and track named-account visits, branded search, content engagement, and later replies. Compare exposed accounts with similar accounts that received only outbound contact. This distinction prevents the email from receiving credit for demand created through search, LinkedIn, or an AI assistant.
Thought leadership can create consideration before a sales request. The Edelman-LinkedIn 2024 B2B Thought Leadership Impact Study, based on 3,484 global business executives, found that 75% of B2B buyers and C-suite leaders had researched a previously unconsidered product or service after consuming a particular piece of thought leadership. Among those respondents, 60% realized their organization was missing a significant business opportunity, and 73% considered thought leadership a more trustworthy basis for judging capabilities than traditional marketing materials. Edelman and LinkedIn’s study supports making niche expertise visible before outreach.
A reliable sequence therefore has two systems: authority creation before contact and disciplined follow-up afterward. The first makes the agency recognizable. The second creates several relevant opportunities to respond. Pipeline reporting should connect both systems to account quality and meeting progression.
Measuring Response Quality and Pipeline Impact
A response isn’t demand. Your CRM should classify every reply before the team reports performance.
| Reply category | Commercial meaning | Pipeline treatment |
|---|---|---|
| Positive response | The contact signals relevance or interest | Route for qualification |
| Qualified meeting | The account and business need meet entry criteria | Count as pipeline activity |
| Objection | The contact identifies a barrier or mismatch | Log separately from demand |
| Referral | The contact redirects you to another person | Track the new contact and account |
| Polite acknowledgment | Engagement without buying intent | Exclude from positive rate |
| Unsubscribe or opt-out | The recipient rejects future commercial contact | Suppress immediately |
Report positive-reply rate by role, industry, geography, account tier, and intent stage. Then connect each positive reply to meetings, opportunities, and closed revenue in the CRM. A campaign with a lower total reply rate can be superior if its positive replies come from the economic buyer and progress to qualified meetings.
Compliance belongs in the same dashboard. The U.S. Federal Trade Commission’s CAN-SPAM compliance guidance requires commercial email to include a clear opt-out explanation, a return email address or another simple online opt-out method, and an opt-out mechanism that can process requests for at least 30 days after sending. Senders must honor opt-outs within 10 business days, cannot charge a fee, and cannot demand information beyond an email address.
For an agency sending through multiple salespeople or contractors, suppression must work across every mailbox and sequence. Track complaint rate, unsubscribe processing time, bounce rate, delivery health, positive replies, and qualified meetings together. A reply-rate increase that damages sender reputation or ignores recipient controls is negative pipeline economics.
Diagnostic Checklist for Stalled Pipeline
When replies arrive but meetings don’t, don’t start by rewriting the subject line. Diagnose the account, recognition, offer, and qualification logic in order.
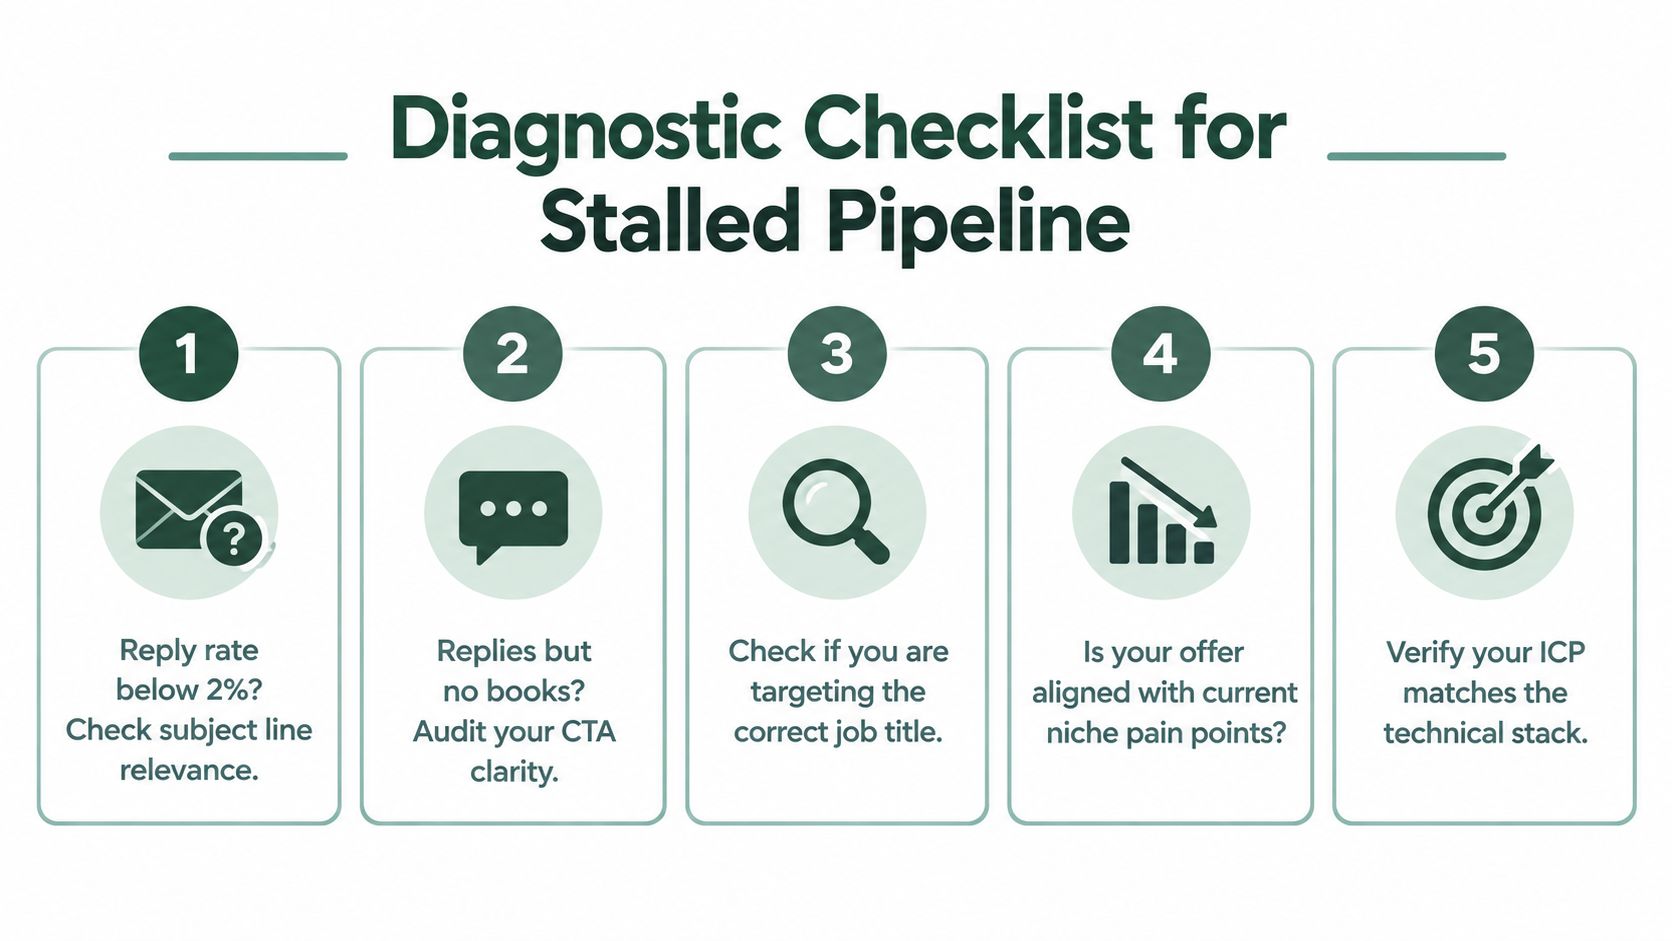
Check the target before the message
- Validate the account set: Confirm that each company fits the agency’s chosen vertical, geography, technical environment, and buying context.
- Inspect the role: A reply from an individual contributor may reveal useful pain, but it doesn’t automatically represent buying authority.
- Separate reply types: Remove objections, referrals, acknowledgments, and opt-outs from the positive-response calculation.
- Audit the offer: Tie the call to a defined business problem, not a general capability statement.
- Test recognition: Check whether the account encountered a relevant technical asset before the first outbound message.
- Review the sequence: Change the reason to respond on each follow-up instead of repeating the original pitch.
A stalled campaign often reflects invisible positioning, not weak writing. If the account can’t quickly understand why the agency belongs in its category, more volume only expands the error.
The useful decision is whether to fix targeting, authority, or conversion mechanics first. If the right accounts never reply, narrow the niche and improve recognition. If replies contain interest but no meetings, clarify the next step and qualification criteria. If meetings occur but opportunities don’t progress, inspect the problem fit and buying committee rather than celebrating the inbox rate.
Before launching another sequence, export the last campaign by account, role, audience temperature, reply type, and meeting outcome. Recalculate the rate of response with separate denominators, identify the cohort producing qualified conversations, and build the next authority asset for that niche. That process turns outreach from a volume exercise into a defensible pipeline system, and it gives your agency a clearer competitive position before the next buyer chooses a shortlist.