What Is a Good Open Rate in 2026
Learn what a good open rate is in 2026, with real benchmarks, MPP corrections, and practical fixes dev agencies can apply to cold email and lifecycle.
A reported 35% to 45% open rate often maps to a true 20% to 25% human-engaged rate after Apple Mail Privacy Protection and automated opens are removed. A good open rate in 2026 is therefore a corrected number tied to the email type, not a single universal threshold.
For a software development agency selling into a narrow B2B market, the dashboard number is often the least reliable part of the funnel. Apple Mail Privacy Protection prefetches tracking pixels, security systems generate automated opens, and email platforms combine those events with human reads. Several 2026 benchmark summaries estimate that Apple-related inflation can push reported results 15 to 20 percentage points above actual human engagement (Geysera’s 2026 benchmark analysis).
That changes the operating question. Instead of asking whether a campaign reached 45%, a CEO should ask whether the corrected rate is comparable to prior campaigns, whether the right buyers opened it, and whether those opens produced replies or meetings.
What a Good Open Rate Means in 2026
A good open rate is a number that remains useful after its denominator is corrected. The historical 20% to 25% range still works as a human-engaged baseline. A dashboard showing 35% to 45% may instead include machine-generated opens from Apple Mail Privacy Protection. Reported averages in one benchmark review ranged from about 19.21% to 43.46%, depending on the measurement method.
For a dev agency, list composition matters more than another round of subject-line edits. A cold outbound list of CTOs, procurement leaders, and role-based addresses behaves differently from an opted-in newsletter or a product-triggered lifecycle sequence. Apple, Gmail, and Outlook users also produce different levels of measurement distortion, so campaigns aimed at comparable buyers can show different reported results.
MPP changes the denominator, not the quality of the audience. That makes a raw open rate unsuitable for comparing email types or judging buying intent.
Working definition: A good open rate is a corrected, audience-specific signal for diagnosing inbox placement and subject-line relevance. It does not demonstrate purchase intent.
Subject-line clarity still matters. Guidance on how to write a clear subject line can improve the chance of a human open, but it cannot repair an outdated list or separate a genuine read from a prefetched pixel.
The useful comparison is therefore between reported opens and human-engaged opens, measured against the email’s job. For low-volume B2B software outreach, reply rate is the stronger pipeline signal. An open can indicate attention. A reply indicates that the message created enough relevance for a buyer to respond.
Reported Open Rate vs the Human-Engaged Rate
An email platform records an open when its tracking pixel loads. That event doesn’t always mean a person read the message. Apple Mail Privacy Protection can prefetch the pixel, security scanners can inspect links and images, and forwarding or mailbox previews can create additional loads without meaningful engagement.
The scale is material. A 2026 review estimated Apple’s share of tracked opens at roughly 49% to 58%, which makes raw dashboards especially unreliable for agencies targeting executives who use Apple devices (Newsletrix’s Apple MPP analysis). Another benchmark comparison reported average opens of 41.2% across senders but estimated actual unique human opens at 19.6%, a gap of 21.6 percentage points (Visionary Marketing).
The correction isn’t identical across every motion. The table below uses the ranges identified in 2026 benchmark guidance for common agency campaigns.
| Email Motion | Reported Open Rate | MPP-Corrected Rate | Typical Correction |
|---|---|---|---|
| B2B cold outbound | 35% to 65% | 20% to 30% | Material, especially on Apple-heavy lists |
| Newsletter and nurture | 40% to 55% | 20% to 30% | Material, because opted-in lists create more reported opens |
| Transactional email | 50% to 70% | Context-dependent | High reported activity, but not comparable with prospecting |
These ranges come from benchmark guidance that places B2B cold email around 35% to 65%, newsletter and nurture mail around 40% to 55%, and transactional email around 50% to 70%, while warning that MPP inflates the reported figures (BounceZero).
A practical audit should pair corrected opens with replies. Agencies should also begin with validating email lists for outreach (100Signals), because invalid addresses and role-based mailboxes contaminate performance before privacy technology enters the picture. Teams evaluating adjacent channels can also use this WhatsApp newsletter guide from Double My Leads to compare how engagement is measured outside email.
Benchmarks by Email Type and Region
A single “good” open rate cannot govern every email motion. Cold outbound asks an unfamiliar buyer to begin a conversation. Lifecycle email follows an action the recipient has already taken, while a newsletter benefits from an existing subscription relationship. Combining these motions makes the benchmark less useful and can lead to the wrong campaign decision.
The 2026 datasets point to a contaminated baseline. Conventional email marketing often treats the low 20% range as healthy after MPP correction, while highly engaged or MPP-inflated audiences can report results above 40% (Geysera). Regional reporting also varies. Brevo recorded 58.8% total opens and 40.08% unique opens in the Americas, compared with 47.6% total opens and 34.5% unique opens in APAC (Brevo).
| Motion | What “good” should mean | Agency interpretation |
|---|---|---|
| Cold outbound | Corrected opens in the low-to-mid 20% range can be healthy | Judge performance mainly through replies and qualified conversations |
| Demo follow-up and trial nurture | A stronger corrected rate is expected because intent already exists | Compare opens with clicks and activation behavior |
| Founder newsletter or product update | Higher corrected engagement can fit a voluntary subscriber base | Track sustained readership and downstream action |
Region should act as a comparison filter, not a justification for weak results. Reported and unique-open baselines differ between APAC and the Americas, and those differences can reflect list composition or measurement practices rather than stronger messaging. Separate North America, EMEA, and APAC cohorts before setting a target. Outlook-heavy EMEA lists may produce a different corrected baseline from Apple-heavy North American executive lists, but the available benchmarks do not justify assigning a fixed regional penalty.
Email type and vertical also alter the denominator and the buyer’s reason to engage. CTO outreach for SaaS tooling, services sold to other dev shops, and regulated fintech work face different curiosity and compliance constraints. A campaign with corrected opens below the low-20% benchmark should trigger a deliverability and targeting audit before a copy rewrite. Healthy opens with no replies point instead to a positioning or offer problem, so reply-rate should carry more weight in pipeline assessment.
Why Open Rate Stops Being the Right KPI
Open rate is a useful diagnostic until the audience becomes narrow, privacy-heavy, or behaviorally noisy. It can tell an agency that a message probably reached an inbox and that the sender line wasn’t immediately ignored. It can’t reliably tell the CEO whether a target account understood the offer or wants a conversation.
Apple MPP is the obvious source of contamination, but it isn’t the only one. Cold lists include role-based addresses, automated forwarding, CRM digests, and dormant contacts. Those events change the denominator without creating pipeline. A high reported rate can therefore coexist with weak commercial intent.
| Condition | Why Open Rate Distorts | Better Signal |
|---|---|---|
| Apple-heavy audience | Pixel prefetching records opens without a human read | Replies and positive replies |
| Narrow ABM list | Small changes create unstable percentages | Meetings booked by account cohort |
| Role-based addresses | Several people or systems may access one mailbox | Named-contact engagement |
| Automated forwarding | A forwarded message can generate an open without intent | Clicks, replies, and account progression |
| Strong opens but no response | Subject line attracts attention without matching the offer | Positive reply rate and qualified meetings |
A reported open rate below 30% in cold outreach is commonly treated as a deliverability warning, while elite targeted campaigns can reach 55% to 65% reported opens (LeadRiver). Those figures are useful for triage, not revenue forecasting.
A subject line can win the open and lose the opportunity.
Before changing copy, check sender authentication, list quality, and inbox placement. Practical SPF and DKIM setup tips help establish that technical baseline. Once delivery is sound, make reply rate, positive reply rate, and meetings booked the primary signals for cold outreach. Open rate stays in the report, but it no longer owns the decision.
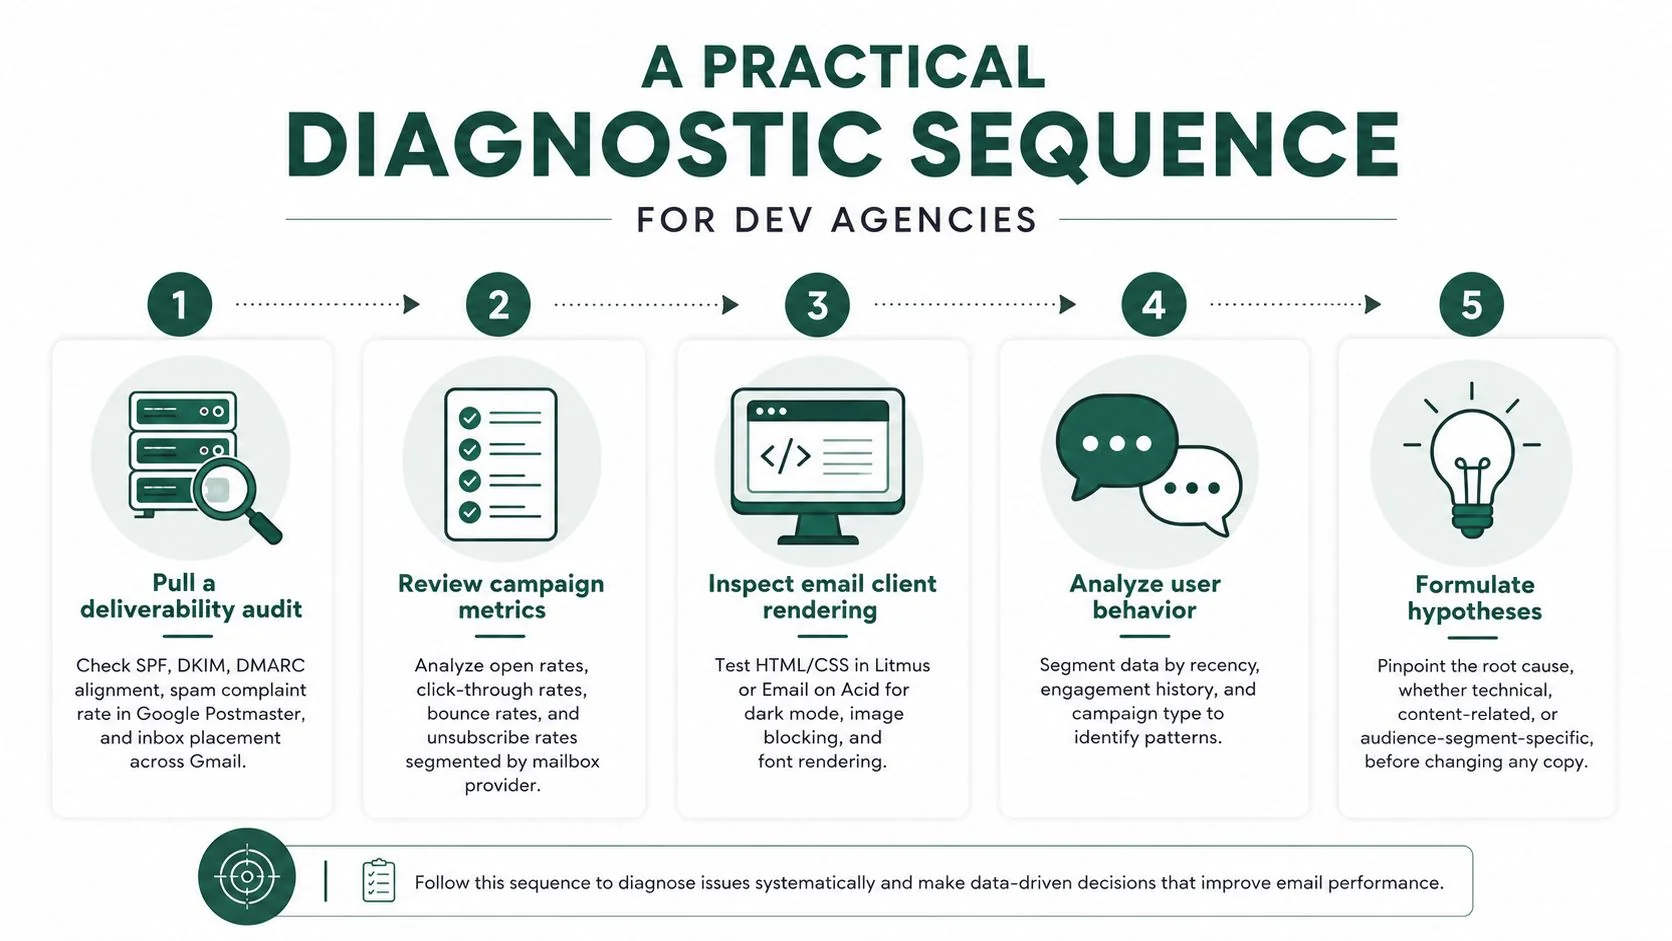
A Practical Diagnostic Sequence for Dev Agencies
A dev agency shouldn’t rewrite its sequence because an ESP dashboard moved. Use a fixed diagnostic order so technical failures don’t get mistaken for weak positioning.
Start with deliverability
Pull the audit first. Check SPF, DKIM, and DMARC alignment, review spam complaint data in Google Postmaster, and test inbox placement across Gmail, Outlook, and Apple with a seed-list tool. Fix placement problems before testing subject lines. A subject-line experiment can’t produce a clean result when messages land in spam or promotions.
Separate the cohorts
Don’t blend active contacts with dormant and cold prospects. Create separate views for contacts active in the last 90 days, dormant for 90 to 180 days, and cold recipients. Compare reported opens, corrected opens where available, replies, and positive replies inside each cohort. A blended number hides whether the problem comes from audience fatigue, targeting, or a new sender domain.
For a narrow ICP, mailbox-provider cuts matter as well. Apple-heavy results require more correction than a Google Workspace-heavy B2B segment, so the same campaign should be reviewed by provider before leadership treats a change as real.
Test one subject-line variable
Use a controlled test with at least 2,000 sends per variant and no more than four variants, as specified in the diagnostic plan. Change one variable at a time, such as length, a personalization token, or a question versus a statement. If copy clarity is the suspected issue, resources such as demand generation resources for dev shops can support the broader positioning work, but the email test still needs a single measurable change.
Audit cadence before adding personalization
Review the sequence timing and number of touches before adding more personalization. The prescribed cold-outbound comparison is three to five touches over fourteen days versus seven touches over thirty days. Treat that as a testable operating hypothesis, not a universal law. The right cadence depends on buying cycle, account quality, and whether recognition already exists.
Add AI only after the system is stable
AI-assisted personalization belongs at the end of the sequence. If deliverability, segmentation, cadence, and measurement aren’t stable, personalization adds production effort without fixing the cause. Tools can help research accounts and adapt language, but they can’t turn a contaminated open into a qualified opportunity.
Connecting Open Rate Work to Pipeline
A niche-authority program doesn’t need a universal open-rate target. It needs a corrected operating range, a reply benchmark, and a consistent account cohort. The specified pipeline model uses a corrected open rate between 25% and 35%, a reply rate above 4%, and a positive reply rate above 1%, tracked weekly against the same audience and measured with the same correction method (EmailAwesome’s 2026 benchmark analysis).
Those targets only become useful when connected to commercial movement. Map opens to replies inside a 14-day window. If corrected opens rise while replies stay flat, the subject line may be attracting the wrong people or creating a promise the body doesn’t fulfill. If both opens and replies fall, investigate deliverability, list quality, and targeting before rewriting the offer.
The weekly report should put the following measures beside open rate:
| Pipeline measure | What it answers |
|---|---|
| Meetings booked per 100 sends | Does attention turn into scheduled conversations? |
| Qualified opportunities per 100 sends | Are replies coming from accounts that fit the ICP? |
| Revenue influenced | Does the motion contribute to active pipeline? |
For a dev agency, niche authority changes the interpretation of every email metric. A prospect who has already encountered the agency in search, LinkedIn, or an AI answer may respond differently from a completely cold recipient. That doesn’t make opens irrelevant. It means the agency should track recognition, account fit, reply quality, and meetings rather than treating an inflated dashboard percentage as demand.
A good open rate is the corrected input, not the business outcome. Use it to diagnose inbox placement and message relevance, then defend pipeline investment with replies, qualified meetings, and opportunities created from the target niche. If your agency needs a measurement system that connects niche positioning to outbound execution, request a 100Signals positioning scan and bring the corrected email metrics, reply data, and account cohort to the review.