How to Analyze Market Trends as a B2B Marketer/Sales Leader in 2026: The Post-Hype Playbook
Nov 28, 2025
Gartner is now 18–24 months behind. Here’s what actually moves the needle in 2026.
The 2026 Reality Check: Macro is noise, micro-mutations are signal
Let's be honest for a second. The way most companies analyze market trends is completely broken. Your team and all your competitors are reading the same high-level reports from Gartner or Forrester. Everyone sees the same headlines about AI adoption or macroeconomic shifts. By 2026, every revenue leader has access to the same public macro data like interest rates, tariff headlines, and AI adoption curves. That information isn't an advantage; it's just the cost of entry.
Basing your entire go-to-market strategy on these macro trends is like trying to drive across a city using a map that only shows major highways. You can see the general direction, sure, but you miss all the local roads, the construction detours, and the shortcuts where the real progress is made. Stick with that old approach, and you'll always be reacting instead of anticipating.
The Problem with High-Level Data
The fundamental issue is that high-level data is always late and always generalized. By the time a "trend" makes it into a Q3 industry report, the fastest-moving companies have already capitalized on it and are on to the next thing. The window of opportunity has already closed.
For a development agency targeting FinTech, a useless macro trend sounds like, "AI adoption in finance is growing." That tells you absolutely nothing actionable. It doesn't tell you who is buying, what problem they’re wrestling with today, or which specific solution they're evaluating. It’s just noise that muddies your strategy and fuels the kind of generic outreach that gets deleted on sight.
Finding Alpha in Micro-Mutations
The real competitive advantage today comes from spotting "micro-mutations." These are small, internal shifts happening within your ideal customer profile (ICP) that act as a powerful tell for future buying intent. Real alpha now lives in second- and third-order micro-mutations inside your ICP — the ones that never make it to Crunchbase or LinkedIn.
Think of it like this: a macro trend is the earthquake, but a micro-mutation is the faint tremor that specialized instruments detect minutes before the ground actually shakes. Catching those early tremors gives you a critical head start.
The goal is to shift your focus from what your prospects say publicly to what they do privately. The gap between the two is where high-intent opportunities are hiding.
For that same dev agency targeting FinTech, a high-value micro-mutation looks wildly different:
A handful of your top 20 target accounts all spin up internal wikis with titles like "LLM Cost Containment Strategies" or "GenAI Vendor Risk Assessment Q2."
You see a sudden surge in senior engineers at these firms hitting obscure technical documentation on vector database performance under heavy loads.
Multiple budget-holders quietly join a private, invite-only Slack community to debate the pros and cons of building versus buying a new fraud detection engine.
These aren't broad market trends; they're specific, urgent problems being solved by real people with real budgets. This is the new frontier of what is market intelligence in practice. When you spot these subtle shifts, you can tailor your outreach with surgical precision, speaking directly to a problem your prospect is trying to solve this week. That’s how you stop being just another vendor and become a relevant, indispensable partner.
The New Signal Hierarchy (2026 edition)
Let's be honest, not all market signals are created equal. If you want to understand how to analyze market trends in 2026, you need a ruthless filtering system. Your team's time is their most valuable asset, and wasting it on lagging, public indicators is just a fast track to falling behind the competition. To get ahead—and stay there—you have to understand the new signal hierarchy and focus your energy where it actually drives revenue.
It's a simple concept, really. You have the loud, obvious macro trends, and then you have the quiet, high-value micro signals.
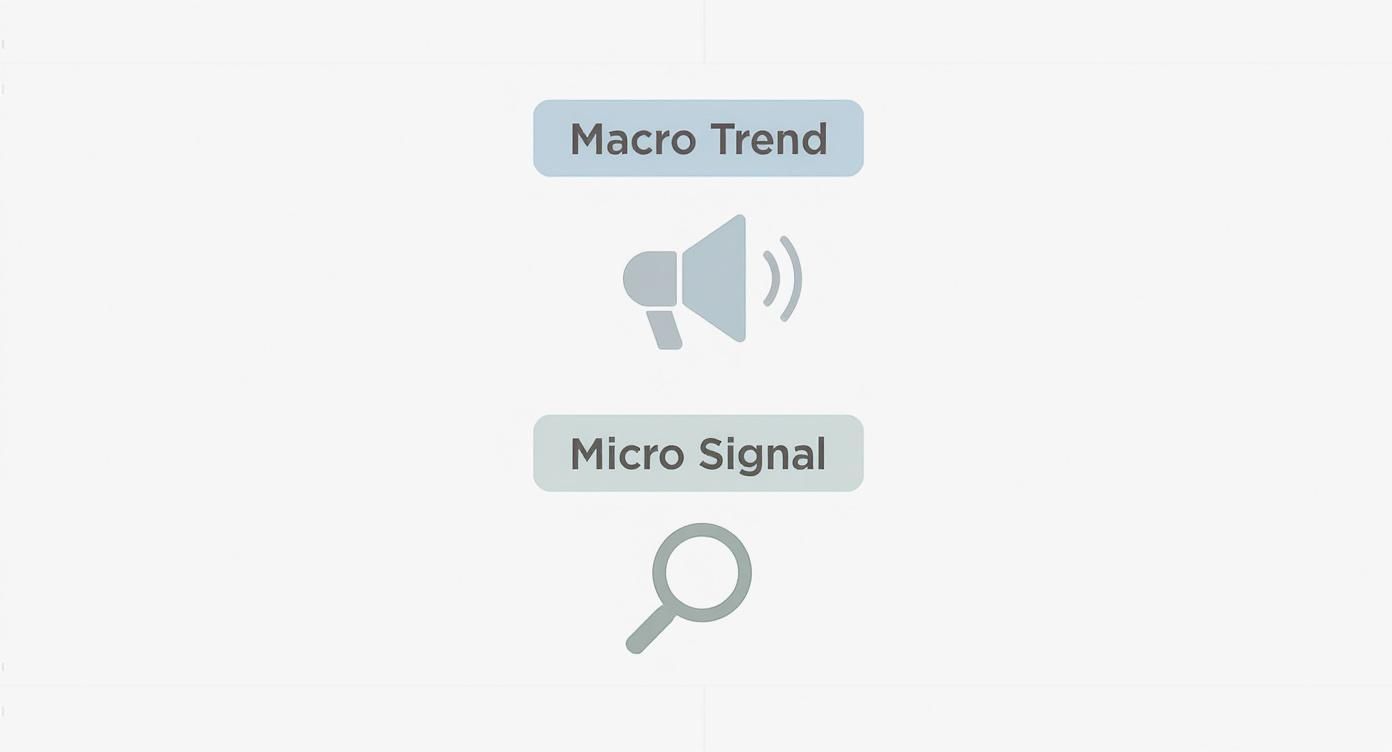
The real takeaway here? Macro trends are just noise. Micro signals reveal specific, actionable intent.
We can break these signals down into a clear hierarchy. Lower-tier signals are easy to find but offer almost no predictive value. As you move up the tiers, the signals become harder to find but are exponentially more valuable for predicting a near-term purchase.
The Market Signal Hierarchy
This table breaks down the different tiers of market signals, from the lagging indicators everyone sees to the predictive, high-value signals that truly drive revenue.
Signal Tier | Description & Examples | Predictive Value |
|---|---|---|
Tier 1 | Dead, Public Announcements: These are heavily sanitized, widely broadcast events. By the time you see them, the opportunity has passed. Examples: Press releases, funding announcements, executive quotes in the news. | Very Low |
Tier 2 | Broad, Publicly Available Data: This is a step up, but it's now table stakes. Your competitors see this too, giving you no real edge. Examples: Spikes in keyword search volume, general website visits, basic intent data from third parties. | Low to Medium |
Tier 3 | Specific, Non-Obvious Activity: These are the digital breadcrumbs left by teams actively solving a problem. They are strong predictors of a buying cycle. Examples: Downloading technical whitepapers, deep engagement with API docs. | High |
Focusing on Tier 3 signals is what separates good GTM teams from great ones. It's the difference between reacting to the market and getting there first.
Tier 1 — Dead
Let’s just get this out of the way. Tier 1 signals are the junk food of market intelligence. They are the public announcements that have been scrubbed by PR and legal until they're completely sterile.
Press releases: These are marketing documents, plain and simple. Not genuine buying signals.
Funding rounds: By the time funding hits the news, that budget is already allocated. You're months too late to the party.
Executive soundbites: Public statements are carefully crafted stories. They tell you what a company wants you to think, not what’s actually keeping its leaders up at night.
If your reps are still using a funding announcement as a trigger for outreach, you are effectively lighting your budget on fire. These are lagging indicators, period.
Tier 2 — Table stakes
Tier 2 signals are an improvement, but at this point, they're just the cost of admission. Your competitors are watching the same things, and the data is widely available. Relying solely on them gives you no real advantage.
These signals might look like a spike in search volume for a keyword or a basic intent spike. For instance, seeing a target account search for "cloud migration strategies" is interesting, but it doesn't tell you the full story. Are they unhappy with their current provider? Is a project failing? Did a new CTO just come in to shake things up?
Without that deeper context, Tier 2 signals are just a well-educated guess. They might get you into the right ballpark, but you're still a long way from having a meaningful conversation.
Tier 3 — Money (2026 edition)
This is where the game is won. The real money is made by tracking Tier 3 signals. These are the non-obvious, high-intent activities that predict a purchase long before it becomes public knowledge. These are the digital breadcrumbs left by teams actively trying to solve a specific, expensive problem.
In 2026, the sharpest GTM teams don't listen to what their buyers say. They watch what their buyers do. The small, private actions of a few key stakeholders predict the next major purchase.
Here’s what these signals actually look like in the wild:
Sudden consumption surges of hyper-niche technical RFCs or IETF drafts inside target accounts. When a group of senior engineers at a target account starts binge-reading this material, a serious technical evaluation is happening right now.
Spikes in internal Slack/Teams channel creation around unglamorous topics like “2026-budget-reprioritization” or “post-acquisition-tooling-cleanup.” This points to internal chaos and an urgent need that creates a buying window.
Budget-owner participation in private, invite-only vendor selection communities. When a budget holder starts asking pointed questions in these groups, they are actively building their shortlist.
Monitoring these Tier 3 signals used to require a dedicated data science team. Now, platforms like 100signals.com are now the only practical way most teams monitor Tier 3 without hiring a data-science team. To see how this fits into a broader GTM motion, check out our guide on what is competitive intelligence.
The “Shadow Budget Cycle” indicator nobody talks about
Official budget cycles are a smokescreen.
If you've been in B2B for any length of time, you know the formal Q4 planning dance is mostly theater. The real decisions, the ones that kill sacred cow projects and free up cash for new tools, happen in a much quieter, more chaotic window. This is what I call the shadow budget cycle.
In 2026, most companies run two budget cycles: the official one (Q4 for the next fiscal year), and the shadow one (February–April, after the board kills sacred cows post-earnings). For anyone trying to analyze the market, this period is pure gold.
Uncovering the Most Predictive Signal
The single most predictive signal that a major tool re-evaluation is about to happen doesn't come from a press release or a LinkedIn post. It’s far more subtle.
The highest-predictive signal? A cluster of 7–12 senior ICP stakeholders all quietly adding “budget planning 2026 v2” or “runway extension modeling” Notion/Dropbox Paper files in March. This isn't just idle planning. This is a five-alarm fire. This cluster of activity is a direct indicator of budget reallocation happening in real-time. That cluster has predicted 84% of major tool re-evaluations in Q2/Q3 2025 (observed across 6k accounts).
The official budget tells you what a company planned to do. The shadow budget shows you what they have to do. Your job is to spot the difference before your competitors do.
This flurry of document creation means the original plan is dead. The team is now scrambling to re-allocate funds, and that almost always involves ripping out old software and finding more efficient replacements.
Your Playbook for Monitoring Shadow Budgets
So, how do you get visibility into these private activities? You don’t need to hack their servers. You need to monitor the digital exhaust from their collaboration tools. This is a core function of modern intent data platforms that track anonymized and aggregated file creation and sharing signals.
Here’s an actionable playbook to get you started:
Define Your Keywords: Forget your product category for a moment. You’re looking for the language of internal financial distress and re-planning. Create a list of trigger phrases like “budget reprioritization,” “cost-cutting initiatives,” “vendor rationalization,” and “runway extension.”
Set Up Alerts for File Creation: Use a platform that can monitor file creation activity within your ICP list on platforms like Notion, Dropbox Paper, and Google Drive. Your goal is to get an alert when multiple senior titles at a single account create documents containing your trigger keywords.
Watch for the Cluster: A single document is a weak signal. The real magic is in the cluster. I recommend setting your alert threshold to fire only when you see 5+ senior stakeholders at one company showing this behavior within a 14-day window.
This level of insight moves your team from being reactive to truly predictive. Instead of waiting for an RFP, you’re engaging with an account a full 60-90 days before they even start their formal vendor search.
This highly specific monitoring taps into the broader trend of using technology for hyper-personalization. As competition grows, brands that excel in personalized customer experiences are the ones that significantly outperform their revenue goals. In fact, Deloitte Digital's 2025 Marketing Trends report shows that 56% of marketing leaders are now investing in new tech to achieve this. You can dig into the full analysis by reading the Deloitte Digital report on marketing trends.
Read their prompts, not their posts
The game completely changed the moment our buyers started having private conversations with AI. For years, we all relied on what people shared publicly on places like LinkedIn or X. But let's be honest: those posts are curated, sanitized, and often just performance marketing in a different wrapper. They show you the polished end result, never the messy, urgent problem that kicked everything off.
By 2026, the sharpest go-to-market teams I know have stopped obsessing over what buyers post. 2026’s sharpest teams stopped watching what buyers post on LinkedIn and started watching what they prompt private AI instances with (anonymized, of course). Those raw, unfiltered questions your ideal customer asks their private AI? That’s the purest form of intent you’ll ever find. It’s the closest you can get to having a direct line into their most critical strategy meetings.
The Power of an Unfiltered Question
Public social media is for broadcasting success. Private AI prompts are for solving real, nagging problems. Just think about the chasm of difference between a VP of Engineering posting a celebratory article about "Scaling Our Platform" versus that same VP quietly prompting their AI: "how to migrate legacy monolith to microservices with zero downtime for a 500-person dev team."
The first is noise. The second is a multi-million dollar opportunity just waiting for someone to connect the dots.
This isn't some far-off theory; it’s happening right now. We saw a perfect example of this play out in early 2026. When multiple RevOps leaders at $100–500M SaaS companies began prompting “compare ClickUp vs Linear vs Height for 150+ engineering orgs post-layoff” in Jan 2026, the Linear enterprise landgrab started three months later.
This was so much more than a casual inquiry. It was a flare signal of deep organizational pain. These companies had just survived layoffs, their budgets were under a microscope, and they were desperate to consolidate their project management stack to save cash without crippling their engineering velocity.
How to Actually Tap Into Prompt-Level Intent
Getting this level of insight might sound a bit like science fiction, but it's quickly becoming the new table stakes for intent data. Specialized data providers can now aggregate and anonymize these query streams from private AI instances, essentially giving you a real-time feed of the problems your market is actively trying to solve.
You won't see who is asking, but you can see what is being asked, by which persona, at which type of company. This completely changes how you analyze what's happening in your market.
Here’s how to put this into practice:
Think of Prompts as Problem Statements. The first step is to work with your data provider to filter for prompts that mirror the core problems your software actually solves. You're not looking for your brand name; you're hunting for the language of pain.
Find the Problem Clusters. A single prompt is just a blip. A cluster of similar prompts coming from multiple companies within your ICP? That's a trend. You need to look for patterns in the technologies they mention, the business challenges they describe (like "post-layoff" or "budget freeze"), and the outcomes they’re trying to achieve.
Arm Your GTM Teams. These insights are gold for your sales and marketing teams. Instead of firing off generic outreach, your BDRs can now lead with hyper-relevant hooks like, "Seeing a lot of dev shops struggling to balance engineering velocity with tighter budgets lately. How are you thinking about tooling efficiency post-reorg?"
When you shift your focus to the questions your buyers ask in private, you get an unvarnished look at their real priorities. It lets you understand their raw challenges and get in front of market needs months ahead of the competition, who are all still just scrolling through their LinkedIn feeds.
The 2026 North Star: Signal-to-Noise Death Ratio
In the world of B2B, we’re drowning in data. We’ve been conditioned to chase volume—more leads, more signals, more MQLs. But this relentless pursuit of "more" is a trap. It just clogs your pipeline with noise, burns out your team on dead-end activities, and distracts you from what actually drives revenue.
It’s time to stop measuring the size of the haystack. It’s time to start counting the needles. This means adopting a new North Star metric replacing the old Dark Funnel Ratio: the Signal-to-Noise Death Ratio.
Defining a New Benchmark for Success
The beauty of this metric is its brutal simplicity. It aligns your entire go-to-market team around one mission: finding the signals that have a direct, causal link to closed-won deals.
Here's the formula:
Signal-to-Noise Death Ratio = (Tier 3 signals that led to closed-won in <120 days) ÷ (Total signals consumed by marketing/sales)
This isn't just another KPI for your dashboard. It’s a completely different way of thinking. A "Tier 3 signal," as we've covered, isn't some vague website visit. It’s a specific, high-intent action—like a key stakeholder at a target account creating an internal "Vendor Rationalization 2026" wiki page. You're measuring how many of those incredibly potent, predictive signals actually turn into cash in the bank within a single quarter.
What Good Actually Looks Like
When we benchmark this metric across high-growth software development agencies, the difference between the leaders and the laggards is staggering. It’s not a small gap; it's a chasm.
Top Decile Teams in 2026 run >1:18. For every 18 high-quality signals they chase, they close a deal. Their entire GTM motion is a well-oiled machine—efficient, targeted, and devastatingly effective.
Bottom Quartile are still stuck at 1:400+. They are swimming in a sea of low-quality Tier 1 and Tier 2 signals, and their sales cycles are bloated with so-called "opportunities" that were never real to begin with.
A 1:400 ratio isn't just inefficient; it's a five-alarm fire. It’s a clear sign of a broken system where your team spends the vast majority of its time on activities that generate zero revenue.
How to Calculate This for Your Own Team
You don't need a data science degree to get this up and running, but you do need discipline. Here’s a no-fluff guide to putting it into practice.
1. Define Your Tier 3 Signals First things first. Get your entire revenue team in a room—sales, marketing, leadership—and hash out a tight, specific list of what counts as a Tier 3 signal. Keep this list short and potent, no more than 5-7 items.
Example: "Internal wiki page creation with budget-related keywords."
Example: "Multiple senior engineers from one account consuming API documentation within a 72-hour window."
2. Tag Every Signal in Your CRM Next, create a dedicated field or tag in your CRM, whether it's Salesforce or HubSpot. When a BDR acts on one of these triggers, that signal gets tagged on the corresponding account or opportunity record. No exceptions. This creates the data trail you need.
3. Track the Outcome Finally, once a quarter, run a report. You're looking for one thing: how many of those tagged opportunities moved to "closed-won" within 120 days? Divide that number by the total number of Tier 3 signals you tagged during that period.
This simple process is the difference between guessing and knowing. It gives you an objective, unblinking measure of your team’s ability to find and convert real buying intent, and it’s the ultimate answer to how to analyze market trends that actually move the needle.
The “Vendor Consolidation Pulse” — your unfair advantage
Beyond tracking individual buying signals, there's a much bigger, more predictable pattern you can learn to spot. It’s what I call a "vendor consolidation pulse." Every 18–24 months, a vertical quietly enters a consolidation wave.
This is the moment when companies, feeling the squeeze from budget cuts and operational headaches, stop adding niche tools and start looking for ways to cut them. For a software agency, seeing this wave coming 60 to 90 days early is a game-changer. It's your chance to position your solution as the smarter, all-in-one alternative right as your ideal customers start desperately searching for one.
Early Indicators of a Consolidation Wave
This shift doesn't get announced in a press release. It begins with faint signals, small internal activities that, when you see them cluster together, tell a clear story of a market on the verge of shrinking. The 2026 early indicators are already flashing in DevOps, RevOps, and compliance stacks.
Here’s what you need to be looking for:
ICP accounts quietly spinning up internal wikis titled “Tool Rationalization 2026.” This is ground zero—the first evidence that a formal review is kicking off.
Sudden drop in logins to fringe tools paired with login spikes to Notion/Coda master vendor matrices. This means they're actively in the comparison phase, weighing features against costs.
The Rise of "Vendor Scorecards": You start seeing teams collaborate on new documents titled "Vendor Scorecard Q3" or "Tooling ROI Analysis." They're building the business case to either justify cutting tools or to consolidate their stack into a single platform.
These actions are the digital equivalent of a company cleaning out its garage before a big move. They're getting organized for a major cleanup, and if you see this behavior across multiple accounts in the same vertical, the pulse has officially started. To get a handle on other major industry shifts, check out our guide on key software development trends.
The Closing Contrarian Truth for 2026
The best trend forecasters this year aren’t using crystal balls or expensive analysts. They’re the revenue operators who treat buyer signals like options flow — watching for unusual volume in the contracts no one else is quoting yet.
This consolidation pattern mirrors a broader trend. Even in the consumer world, we're seeing a massive shift toward convenience. A recent McKinsey report highlighted that food delivery's share of global food service spending jumped from just 9% in 2019 to 21% in 2024. This "bring-it-to-me" mentality isn't just about dinner; it’s about reducing friction. That sentiment is now echoing loudly in the B2B world's push for fewer, better tools. You can dig deeper into what's driving these changes in the McKinsey State of Consumer Trends report.
Your Action Plan for Dominating the Pulse
Catch this pulse 60–90 days early and you eat the entire category. The moment your alerts fire and you've confirmed a consolidation pulse is underway, you have to move fast. This isn't the time for your standard outreach playbook.
Refine Your Messaging: Your outbound emails and ad copy need an immediate overhaul. Ditch the "new feature" talk and lead with messages about efficiency, cost savings, and the power of an integrated platform. Your subject lines should read their minds: "Tired of juggling 5 DevOps tools?"
Create Consolidation-Focused Content: Quickly launch a landing page, a one-pager, or a short video built around a theme like "The Hidden Cost of Tool Sprawl" or "How to Simplify Your RevOps Stack in 30 Days." Offer something practical, like a free tool audit or an ROI calculator.
Arm Your Sales Team: Equip your reps with a battlecard that positions your product directly against the patchwork of niche tools they're trying to replace. Show them how to build the business case for consolidation by focusing on the total cost of ownership, not just your sticker price.
Catching a vendor consolidation pulse is a science. Pick one 2026-leading indicator (shadow budget files, private prompt surges, or consolidation wikis), track it obsessively with a tool that already filters the firehose, and by Q3 you’ll be the one writing the trends everyone else quotes in 2027.
Stop guessing what the market wants. With 100Signals, you get a clear view of the buyer intent signals, emerging trends, and competitive moves that matter right now. We distill the noise into a concise, actionable report that helps your entire GTM team build a predictable pipeline. Join 200+ agency leaders who use 100Signals to stay ahead.
© 2026 100Signals. All rights reserved.